By eileenspinosa
•
February 11, 2025
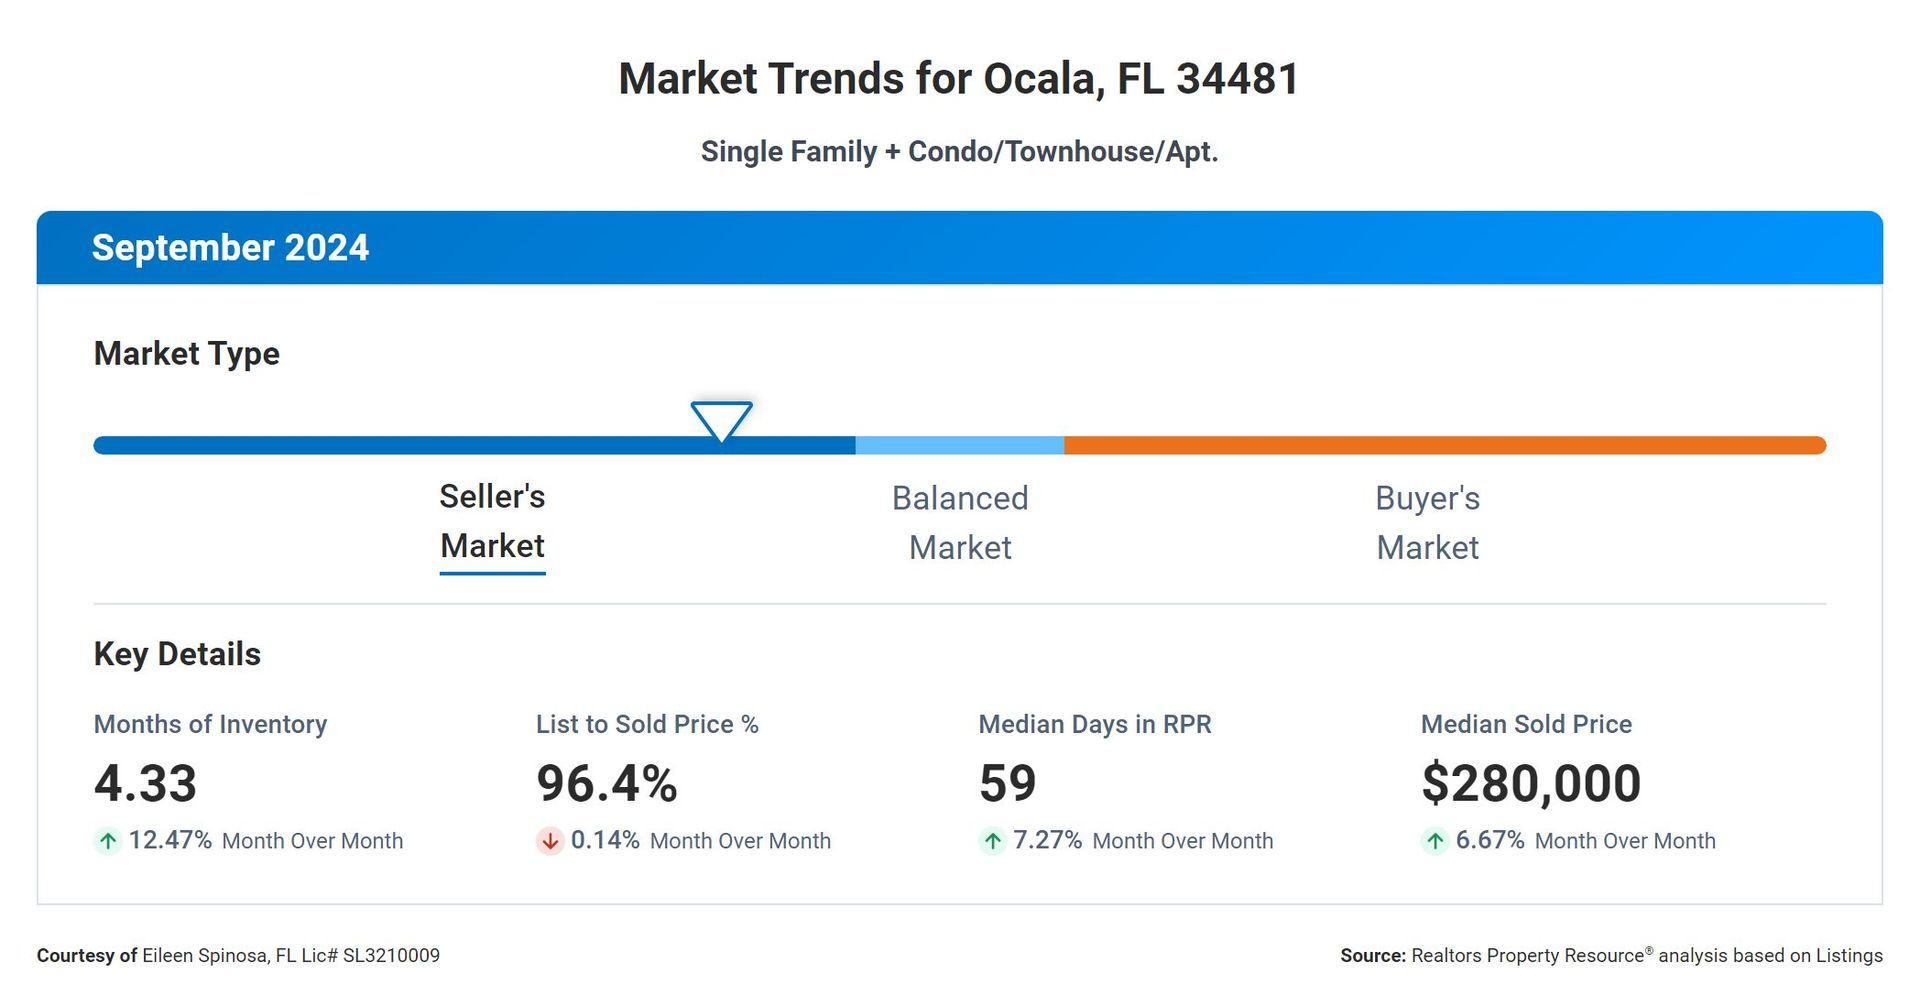
Local Market Trends, Ocala, FL - January 2025 The real estate market is currently showing a healthy balance between supply and demand, as indicated by a Months Supply of Inventory of 5.74. This metric represents the number of months it would take to sell all currently listed homes at the current sales pace. A lower number typically indicates a seller's market, while a higher number suggests a buyer's market. It is important to note that there has been a significant increase in the 12-Month Change in Months of Inventory, rising by +55.56%. This could indicate a shift towards a more balanced market or potentially a slight increase in inventory levels. The Median Days Homes are On the Market is 62, which suggests that homes are selling relatively quickly in this market. This could be attributed to the strong demand for housing and competitive pricing strategies. The Sold to List Price Percentage is 97.1%, indicating that homes are typically selling very close to their list price. This could be a reflection of the overall health of the market and the willingness of buyers to pay asking prices. Finally, the Median Sold Price is $227,000, which gives buyers and sellers a good indication of the current market value of homes in the area. This data point can help guide pricing strategies for sellers and offer insight for buyers looking to make competitive offers. Overall, the real estate market appears to be stable and active, with a good balance between supply and demand. Buyers and sellers can use this data to make informed decisions and navigate the market with confidence. Looking to Buy or Sell anytime soon? Let's Chat! Email Me

By duda
•
March 28, 2022
This is a subtitle for your new post Write about something you know. If you don’t know much about a specific topic, invite an expert to write about it. Having a variety of authors in your blog is a great way to keep visitors engaged. You know your audience better than anyone else, so keep them in mind as you write your blog posts. Write about things they care about. If you have a company Facebook page that gets lots of comments, you can look here to find topics to write about. Write about something you know. If you don’t know much about a specific topic, invite an expert to write about it. Having a variety of authors in your blog is a great way to keep visitors engaged. You know your audience better than anyone else, so keep them in mind as you write your blog posts. Write about things they care about. If you have a company Facebook page that gets lots of comments, you can look here to find topics to write about.
Blog
We are committed to providing an accessible website. If you have difficulty accessing content, have difficulty viewing a file on the website, notice any accessibility problems or should you require assistance in navigating our website, please contact us.
© 2025
All Rights Reserved | Website Powered by National Association of REALTORS®


